AI Infrastructure Economics: A Complete Decision Framework for Data Center Location, Hardware Selection, and Climate Risk — 2025–2026 Research Series
This four-document package represents a complete, end-to-end research series on the economics of AI infrastructure deployment. Together the documents span from strategic site selection through hardware cost modeling, climate risk quantification, and device-level TCO — giving anyone building or investing in AI infrastructure a single authoritative reference.
Document 1 — Zenodo Research Package (doc1.pdf, 8 pages)
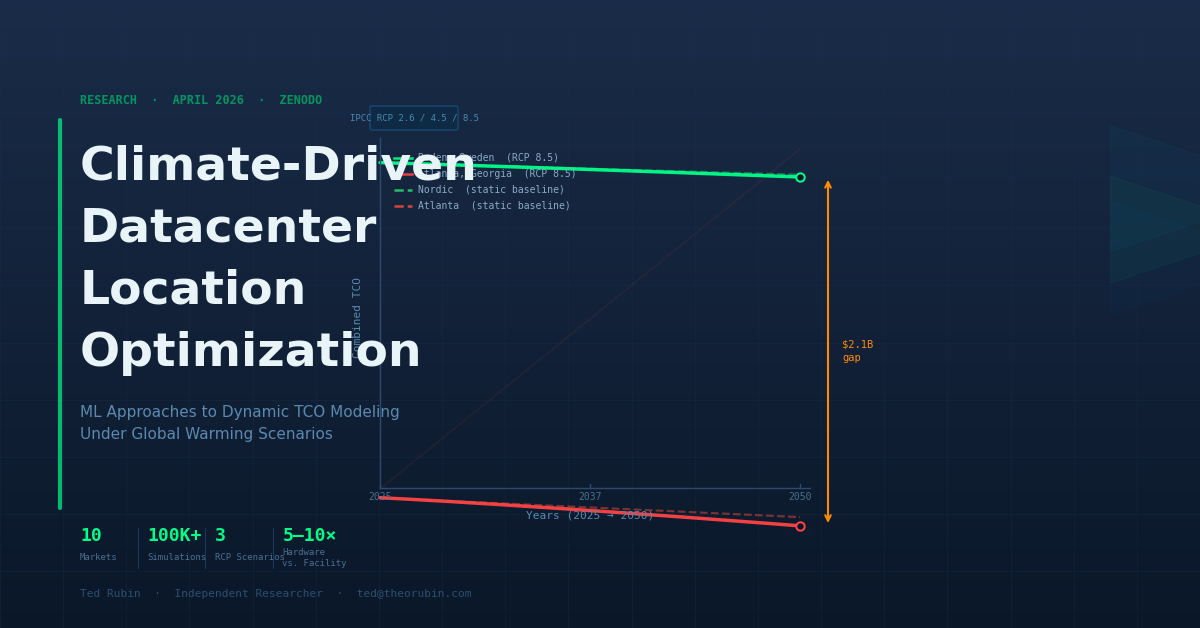
The reproducibility and methodology guide for the climate-driven TCO research. Covers the full Python codebase structure, six Jupyter notebooks, all 10 location configurations, three IPCC RCP climate scenarios, and four hardware tiers. Key findings summarized: Nordic locations maintain a 74–80% TCO advantage over Atlanta under climate modeling, hardware energy costs are 5–10× facility costs for AI-class infrastructure, and the combined Boden–Atlanta gap reaches $2.1B over 25 years. Includes known issues, data download instructions, and citation information for academic use.
Document 2 — DCCore: Global Datacenter Location Optimization (Doc2.pdf, 215 pages)
The primary research study. Using Monte Carlo simulation with 10,000 iterations across 10 global markets, this establishes the definitive cost hierarchy for AI data center locations. Three tiers emerge: Nordic and EU locations (€499–679M over 10 years), US secondary markets ($1.27–1.62B), and traditional premium hubs ($1.67–1.95B). Boden, Sweden is the optimal single location at €499.5M — 75% cheaper than Atlanta at $1,952.1M and paradoxically lower risk. The study covers facility TCO, CapEx modeling, PUE efficiency, power rates, renewable energy access, geopolitical risk, submarine cable connectivity, supply chain diversification under trade policy uncertainty, and a full regulatory comparison across all markets. Also identifies future research directions including climate modeling and hardware cost integration — both addressed in the companion documents.
Document 3 — PC Hardware Cost Addendum (doc3.pdf, 27 pages)
Year-by-year hardware cost projections for all 10 locations across three tiers: Standard AI Rack (H100-based, $3.5M/rack, 100 kW), Traditional PC ($500K/rack, 20 kW), and Hybrid GPU+CPU ($2M/rack, 60 kW), covering a 100 MW / 500-rack reference facility. The central finding: hardware costs dwarf facility costs at every location. Boden's 10-year Standard AI hardware TCO is €9.29B against a facility TCO of €499.5M. Atlanta's hardware TCO reaches $9.76B. Power rate is the dominant hardware OpEx variable — Nordic power at €15–30/MWh versus Atlanta's $65–115/MWh creates a 4–6× differential in energy costs alone, before PUE compounding. Evanston, Wyoming is the only US location approaching Nordic hardware economics due to its immersion cooling capability and $0.03–0.05/kWh power rates.
Document 4 — Apple ARM Device TCO Report (doc4.pdf, 11 pages)
The device-level companion study. Covers the full Apple silicon lineup — Mac, iPad, iPhone, Apple Watch, Apple TV, HomePod — with 3-year and 5-year TCO calculations incorporating purchase price, AppleCare+ coverage, energy consumption, and resale value. Key finding: Apple silicon Macs use approximately 50% less power than comparable Intel/AMD machines, with MacBooks retaining 30–40% of value at 3 years versus 10–20% for comparable Windows laptops. Forrester's Total Economic Impact study shows Mac enterprise deployments deliver 186% ROI over five years. For a 100-device Mac fleet, residual value differences alone can represent hundreds of thousands of dollars at refresh. Also covers AppleCare One (launched July 2025), enterprise coverage options, and detailed depreciation benchmarks by device category — directly supporting the ARM efficiency tier analysis in the companion research.
The through-line across all four documents: every layer of the AI infrastructure stack — from the country you build in, to the power rate you negotiate, to the chip architecture in your racks, to the devices your team uses — has a quantifiable economic answer. The research series provides that answer at each layer, with the methodology to update it as markets change.
Document 1 — Zenodo Research Package (doc1.pdf, 8 pages)
The reproducibility and methodology guide for the climate-driven TCO research. Covers the full Python codebase structure, six Jupyter notebooks, all 10 location configurations, three IPCC RCP climate scenarios, and four hardware tiers. Key findings summarized: Nordic locations maintain a 74–80% TCO advantage over Atlanta under climate modeling, hardware energy costs are 5–10× facility costs for AI-class infrastructure, and the combined Boden–Atlanta gap reaches $2.1B over 25 years. Includes known issues, data download instructions, and citation information for academic use.
Document 2 — DCCore: Global Datacenter Location Optimization (Doc2.pdf, 215 pages)
The primary research study. Using Monte Carlo simulation with 10,000 iterations across 10 global markets, this establishes the definitive cost hierarchy for AI data center locations. Three tiers emerge: Nordic and EU locations (€499–679M over 10 years), US secondary markets ($1.27–1.62B), and traditional premium hubs ($1.67–1.95B). Boden, Sweden is the optimal single location at €499.5M — 75% cheaper than Atlanta at $1,952.1M and paradoxically lower risk. The study covers facility TCO, CapEx modeling, PUE efficiency, power rates, renewable energy access, geopolitical risk, submarine cable connectivity, supply chain diversification under trade policy uncertainty, and a full regulatory comparison across all markets. Also identifies future research directions including climate modeling and hardware cost integration — both addressed in the companion documents.
Document 3 — PC Hardware Cost Addendum (doc3.pdf, 27 pages)
Year-by-year hardware cost projections for all 10 locations across three tiers: Standard AI Rack (H100-based, $3.5M/rack, 100 kW), Traditional PC ($500K/rack, 20 kW), and Hybrid GPU+CPU ($2M/rack, 60 kW), covering a 100 MW / 500-rack reference facility. The central finding: hardware costs dwarf facility costs at every location. Boden's 10-year Standard AI hardware TCO is €9.29B against a facility TCO of €499.5M. Atlanta's hardware TCO reaches $9.76B. Power rate is the dominant hardware OpEx variable — Nordic power at €15–30/MWh versus Atlanta's $65–115/MWh creates a 4–6× differential in energy costs alone, before PUE compounding. Evanston, Wyoming is the only US location approaching Nordic hardware economics due to its immersion cooling capability and $0.03–0.05/kWh power rates.
Document 4 — Apple ARM Device TCO Report (doc4.pdf, 11 pages)
The device-level companion study. Covers the full Apple silicon lineup — Mac, iPad, iPhone, Apple Watch, Apple TV, HomePod — with 3-year and 5-year TCO calculations incorporating purchase price, AppleCare+ coverage, energy consumption, and resale value. Key finding: Apple silicon Macs use approximately 50% less power than comparable Intel/AMD machines, with MacBooks retaining 30–40% of value at 3 years versus 10–20% for comparable Windows laptops. Forrester's Total Economic Impact study shows Mac enterprise deployments deliver 186% ROI over five years. For a 100-device Mac fleet, residual value differences alone can represent hundreds of thousands of dollars at refresh. Also covers AppleCare One (launched July 2025), enterprise coverage options, and detailed depreciation benchmarks by device category — directly supporting the ARM efficiency tier analysis in the companion research.
The through-line across all four documents: every layer of the AI infrastructure stack — from the country you build in, to the power rate you negotiate, to the chip architecture in your racks, to the devices your team uses — has a quantifiable economic answer. The research series provides that answer at each layer, with the methodology to update it as markets change.